

AI in Manufacturing: What Works on the Shop Floor
Most mid-sized plants log more than enough data to make AI pay. Almost none of it has ever been joined up. Here are the eight use cases we are asked about most, four agents that close the gap between a forecast and real action, and how to pick where to start.
22 min read
Walk into any mid-sized plant in Coimbatore or Peenya and you will find the same four things. A machine the whole floor knows is trouble. A maintenance register in a hardback book. A quality inspector the line leans on, and an ERP no one fully trusts. The data to fix most of this is there, sitting in a PLC historian, a paper job card and one person's spreadsheet. Nothing has ever joined them up.
That gap is the real opportunity, and it is why plants get faster AI results than sectors with a glossier name. You do not start from nothing. You start from a decade of shop-floor records, kept with care and then used only to argue about last month.
What follows is the eight use cases we are asked about most. Each one is treated straight, including where it fails. If you read one section only, read the last: picking the wrong first project costs more than picking the wrong vendor.
The Problem
Where the Money Actually Leaks
None of these show up as a line item, and that is why they last. Nothing gets fixed if no one owns the number.
The idle line, not the idle machine
Your bottleneck stops for four hours. You did not lose four machine-hours, you lost four hours of plant output, plus the overtime to catch up. The maintenance budget records the fitter and the part. It rarely records the line.
Value added to parts that were already scrap
A defect made at operation two and caught at operation nine has soaked up seven operations of labour and machine time. Catch it three steps earlier and you get all of that back on each reject.
Servicing equipment that was perfectly fine
Calendar-based maintenance strips healthy machines by design, since part of each interval goes on units that were fine. That is labour and consumables. Each rebuild is also a fresh chance to add a fault that was not there before.
Stock held against uncertainty
Safety stock is the price of not knowing what demand will do. Some of it is needed. The rest is working capital sitting in a rack, since the forecast was a guess and each person hedged.
The Eight
What Each One Actually Involves
They are ordered by how often each turns out to be the right place to start, not by how impressive each one sounds. All eight get the same treatment: what it does, what it needs, and where it fails.
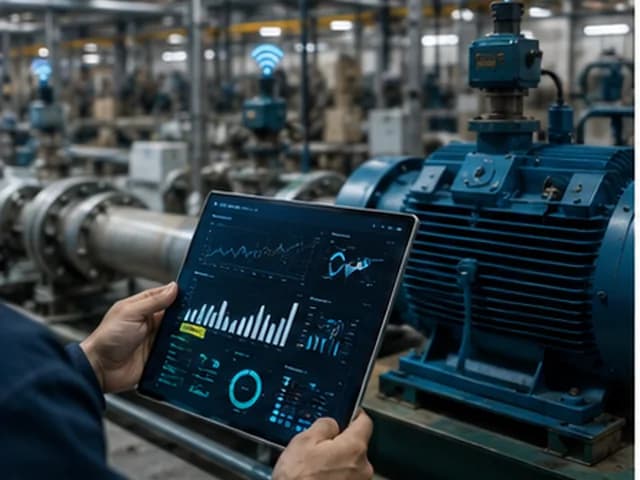
Predictive Maintenance
Service a machine on evidence, not on a calendar drawn up by a stranger.
Machines rarely fail without warning. First they behave a little differently: they run hotter, they vibrate at a frequency they did not use before, they draw more current for the same work. Your best operator hears some of this. That is why the man who has run a machine for fifteen years can tell you it is about to give trouble. He is matching a pattern he learned over years. He also retires one day, and the signal leaves with him.
A model does the same job from recorded data. It learns what each machine looks like when healthy, then watches for drift away from that baseline. It measures distance from normal rather than waiting for a fixed alarm threshold to break. A slow change that never crosses any single threshold is exactly the kind that catches you out. The output is a window, not a date. 'This bearing is likely to fail in two to five weeks' is something a planner can act on. False precision is not.
Machines do not stop breaking. What changes is that failures move from unplanned to planned, and a planned stop costs a fraction of an unplanned one. You service at the weekend with the right part in stores, instead of halting a shift while a driver hunts across town for one.
What it needs
- Sensor or PLC data: vibration, temperature, motor current, cycle time. How often you sample matters more than how many things you sample.
- Maintenance history with dates and reasons, since the labels live here. Paper job cards work, but add weeks of typing.
- Downtime records, even with messy free-text causes. A stoppage that was never logged cannot be recovered.
- Watch for this trap: you predict a failure three weeks out, and the spare has a ten-week lead time. You have swapped a shock for a shock you can see coming.

Visual Quality Inspection
A person inspects well in the first hour, and far less well by the eighth.
The defects that reach your customer are rarely the ones no one could see. They are the ones no one was looking at: the last hour of a night shift, or the day the line ran late and the visual check quietly got faster. If your defect rate differs by shift and no one has explained why, you know this already.
A camera system compares each part against what a good part looks like. It is not a simple image match. Parts vary for honest reasons: position, lighting, finish. A system that flagged all of that would be switched off in a week, and a high false alarm rate kills a project faster than a missed defect does. So the model learns which variation matters. It does not beat a person on eyesight. It beats a person by judging a borderline part the same way at 3am as at 9am.
People underrate the record it builds: each part inspected, and each defect classed by type and tagged to the machine, tool and shift that made it. In year one, the catching pays for the system. In year two, that Pareto lets engineering fix causes instead of sorting symptoms.
Where it goes wrong
- Lighting. Sunlight through a roof panel will break a vision model, and so will a new tube of a different colour temperature. It looks like a software fault for days.
- Too few examples of the defect that matters. Costly escapes are rare, so they are rare in the training data too. Ask for accuracy per defect class, and never accept one overall figure.
- Subsurface defects. Cameras see surfaces, so a crack inside a casting needs ultrasonic or X-ray. No amount of modelling changes that.
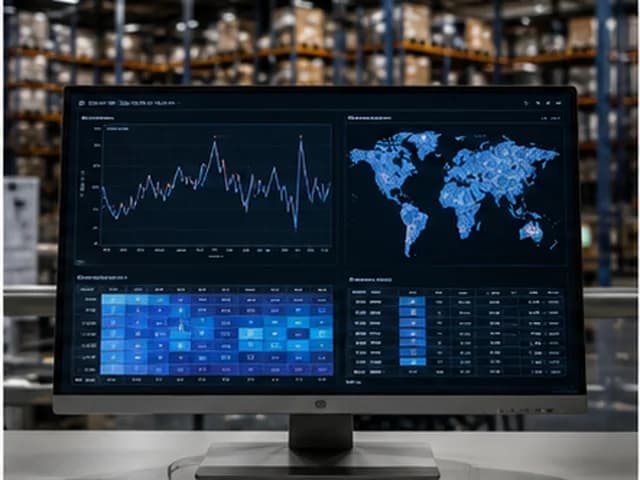
Demand Forecasting
Plan output on evidence, not on whoever argued hardest in the Monday meeting.
Most plants forecast by taking last year's number and adding a percentage that reflects the mood in the room. This works well enough for stable, high-volume lines, and badly for the rest. That is why safety stock exists, and why it grows quietly.
A statistical forecast reads the same records. It then splits out what is driving them: the trend, the season, the effect of a price change. It picks up that one customer who always orders heavily in the fortnight before their own year end. You get a range with a confidence band, not one number. That sounds like hedging, and it is the useful part. 'Between 8,000 and 11,000, most likely 9,400' tells your planner how much cover to hold. '9,400' on its own says nothing about risk.
This is often the cheapest of the eight to try, since the data already sits in your ERP in a tidy form. It is also the one where a bad build is hardest to spot, because a forecast is only proved wrong months later.
What good looks like
- Forecast error measured where you plan: by SKU and by month, not summed up until it flatters itself.
- Safety stock value, tracked against service level. The aim is less stock at the same service level. Less stock on its own is not the aim.
- A test against the naive forecast. If a model cannot beat 'same as last month', it is not worth running, and you should say so out loud.
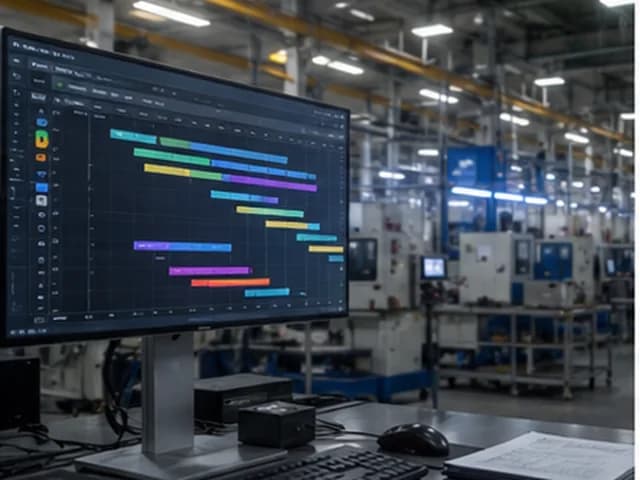
Production Planning & Scheduling
Sequence jobs across machines and shifts, without a spreadsheet only one person can read.
Scheduling looks like an operations job, but it is really a constraint problem. Jobs have due dates and machines have limited capacity. A changeover costs time, and how much depends on what ran before it. Some steps must come before others, and skilled operators are on some shifts and not others. A human planner holds most of this in their head. That is impressive, and it is a real business risk the week they take leave.
An optimiser searches the possible sequences for one that meets the hard constraints and scores well on what you care about. That may be throughput, on-time delivery, less changeover time, or a weighting across all three. The weighting is a commercial call, and you should make it, not the person writing the model.
The honest caveat: this works only if your routing and changeover data are correct. Suppose the system thinks a changeover takes twenty minutes and it really takes ninety. The schedule will be beautiful and useless. Cleaning that data is usually the bulk of the project, and a vendor who does not raise it plans to find it out at your cost.
Four That Usually Come Second
These four are just as real, and in some plants they are worth more than anything above. They work better as a second or third project, because each one leans on data quality, and the first project is what forces you to fix that.

Smart Inventory Management
Reorder points set five years ago are still running your working capital today.
Most plants set a reorder level once, on a lead time that was true at the time, and then no one revisits it. Demand shifts. A supplier gets slower. A new variant arrives. The number stays put. The result is easy to predict: some lines carry months of cover while others run out, and both stay hidden until the next stock count.
Modelling stock well means treating two things as variable rather than fixed: how much you will need, and how long the supplier will really take. A vendor with a steady twenty-day lead time needs far less cover than one who averages fifteen days but sometimes takes forty. A fixed reorder point cannot say that, so it over-stocks the steady vendor and under-stocks the erratic one.
Depends on
- A demand forecast you already trust, so this rarely works as a first project.
- Goods-receipt dates, not just PO dates, so real lead-time variance shows up.
- Consumption history at the level you reorder at.
- A person with the authority to change reorder levels when the model says so.
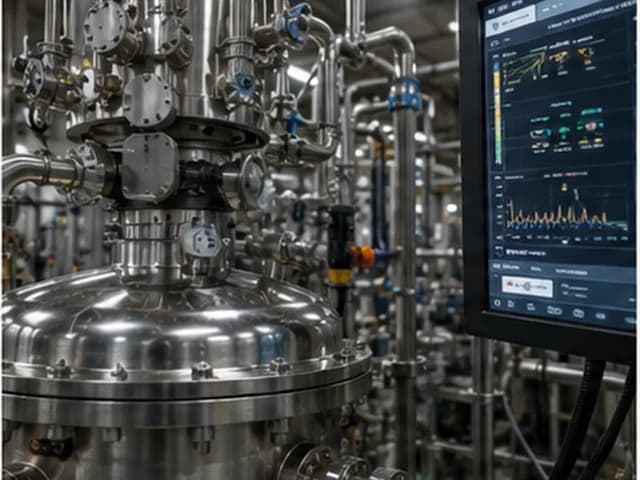
Yield Optimisation
Find which process parameters really drive yield, not the ones people believe do.
Each plant has its folklore. Run it hotter on humid days. This operator gets better output on that machine. Some of it is real and hard-won, and some of it is chance that hardened into a rule years ago and was never tested.
With enough process data, logged often enough, you can tell the two apart. The model looks across temperature, pressure, speed, material lot, ambient conditions and operator, and shows which combinations move yield and which are noise. Often the finding is a link no one was hunting for: this material lot is fine, except when it runs above a certain speed.
The limit is sampling rate. A reading taken once per shift will not find much that a supervisor had not already guessed. If your process data is that thin, better logging is the project, and it is worth doing on its own.
Reality check
- Correlation is not a control setting, so a process engineer must check any finding before the recipe changes.
- Needs process parameters logged per batch or per minute, not per shift.
- Works best in continuous and batch plants with many linked variables.
- Material lot and ambient conditions matter more than most plants record.
Energy Consumption Analytics
The easiest business case to prove, since the saving lands on a bill you already get.
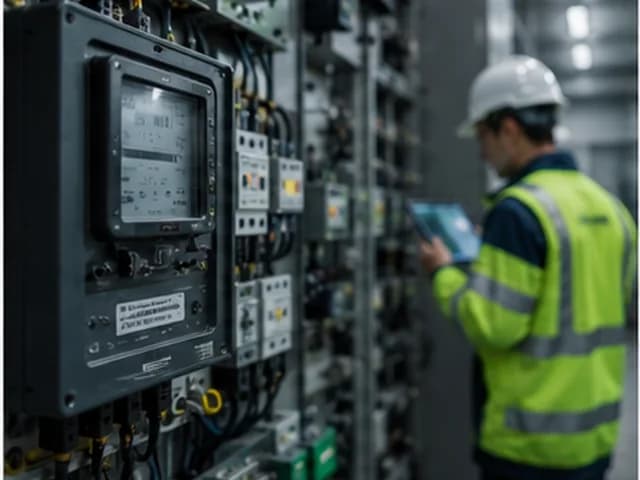
Energy is billed at plant level and managed at plant level, so no one can say what a machine, a shift or a product costs to run. Attribution fixes that: you break usage down by asset and by job. The cost of a product then includes the energy that went into it, not an averaged overhead.
The second half is forecasting load to manage peak-tariff exposure. Your tariff may penalise demand above a threshold, and it is worth real money to know in advance that three heavy loads are about to coincide. You stagger them. This is arithmetic more than intelligence, but it needs a forecast to work.
We often suggest this first for a plant that wants a provable win before it commits to more. Sub-metering is cheap and the data is clean. The result shows up on next quarter's bill, where the finance director can see it.
Why it is a good first project
- Sub-meters are cheap and quick to fit.
- The baseline already sits in twelve months of bills.
- Results show up in weeks, not quarters.
- It builds the data plumbing that later projects reuse.
Worker Safety Monitoring
The simplest of the eight to build, and the one most likely to fail on people.
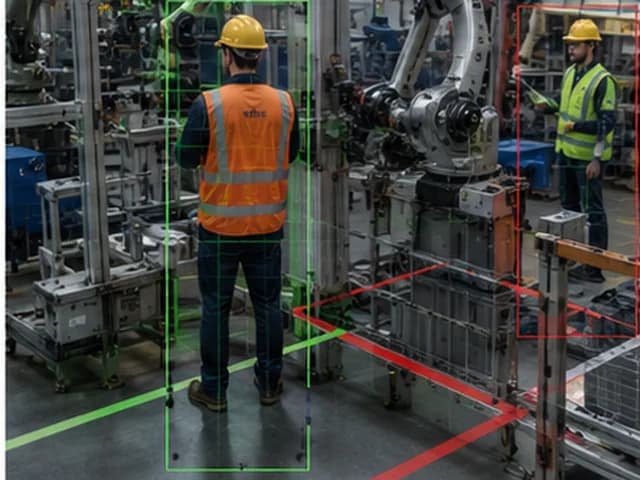
Spotting missing PPE, entry to a restricted zone, or a worker too close to moving machinery is well-solved computer vision. Most plants have the cameras already, so that part is not hard.
What decides whether it survives is how you frame it. Run it as surveillance of individuals, with named alerts and discipline to follow, and the floor will resent it. Staff will work around it, and one day it gets unplugged, often with a supervisor's help. Run it as monitoring of conditions instead. Alert a zone, not a person, and report in aggregate. Then the shop floor accepts it, and at times welcomes it.
We raise this before the technical scope, since this is the real risk. There is a legal side too: India's DPDP Act covers workplace monitoring and notice to staff. Take advice on it rather than assuming.
Get this right first
- Alert on zones and conditions, not on named people.
- Agree the policy with supervisors and workers before you install, not after.
- Report in aggregate, with near-miss counts by area, not by person.
- Take advice on DPDP Act duties for workplace monitoring.
Where We Specialise
Agents That Do the Work, Not Just the Maths
Everything above predicts something and hands you a number. That is useful, and it is also where most AI projects stop. You get a dashboard, and a person still does the work the dashboard implied. Knowing a bearing will fail is one thing. Raising the work order, holding the part and booking a slot is another. That stretch is all manual, and the benefit leaks away there.
An agent closes that gap. It reads the same systems a coordinator reads, decides what needs doing, and then does it. It raises the requisition, chases the vendor, drafts the report. It works to rules you set, and a human approves anything that matters. This is the part of our work we are asked for most, and the four below pay back fastest on a shop floor.
None of these replaces a person. They remove the twenty minutes of gathering that comes before a person can decide, which in most plants is where the hours go.

Downtime Response Agent
A machine stops at 2am, and the case file is written before the engineer arrives.
Today a stoppage starts a scramble. One person checks when it was last serviced. Another tries to recall whether this happened before. A third hunts for the right page of a manual that lives as a PDF on a laptop in the office. Twenty to forty minutes go by before real diagnosis starts, and on a bottleneck asset those are the costliest minutes of the day.
The agent triggers on the stoppage itself. It pulls the machine's recent sensor trace and its last three service records. It pulls each earlier stoppage with the same fault code, and what fixed them. It pulls the right section of the OEM manual, plus current stock of the parts those fixes used. It builds a briefing and sends it to whoever is on call, so it lands before they reach the machine.
Where you allow it, the agent goes further. It holds the likely spare, raises the work order in draft, and tells the planner the schedule needs resequencing. Each of those actions is a rule you set, and anything with a cost attached waits for a human yes.
What it touches
- SCADA or PLC, for the fault code and the trace leading up to it.
- Maintenance history and past fault fixes.
- Spares stock and reorder status.
- OEM manuals, indexed so it pulls the right section, not the whole book.
- The work-order system, in draft, and never auto-approved.
- Whoever is truly on call, on the channel they read.
Procurement & Reorder Agent
The chasing that eats a purchase officer's week, done daily and without a reminder.
Procurement in most plants is one person with a spreadsheet and a phone, working through a list of things that might be late. The work is not hard. It is relentless, and easy to drop. An order slips two weeks because no one chased it on the right day, and the first anyone hears of it is when the line stops.
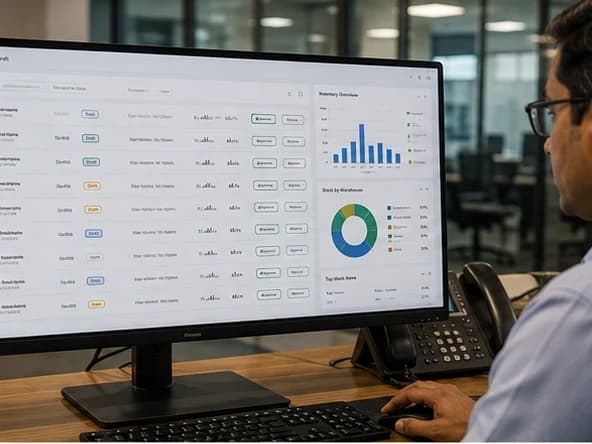
The agent watches stock against usage and open orders. When an item crosses its reorder point, it drafts the requisition with the right vendor, quantity and date. It chases unconfirmed POs on a schedule and flags any promised date that has moved. It escalates when a late delivery threatens a booked job. Not late in the abstract. Late in a way that will cost you.
The judgement stays yours. Approval limits, which vendors it may use, whether it can split an order: all of these are rules you write. What it removes is the twenty small follow-ups a day that no one has time for and the plant pays for.
Where it pays off best
- Plants with hundreds of SKUs and one or two purchase staff.
- Vendors whose promised dates move, with no one noticing until receipt.
- Consumables that stop production when missing, and that no one owns.
- Set approval limits before go-live, not after the first surprise PO.
Quality Incident Agent
When rejects spike, the enquiry starts itself instead of waiting for a meeting.
A reject rate climbs on Tuesday. It gets noticed on Thursday, when the numbers are compiled, and discussed on Friday. By then the material lot has been used up, the tool has been changed, and the operator does not recall the shift. The evidence that would have found the cause has gone.
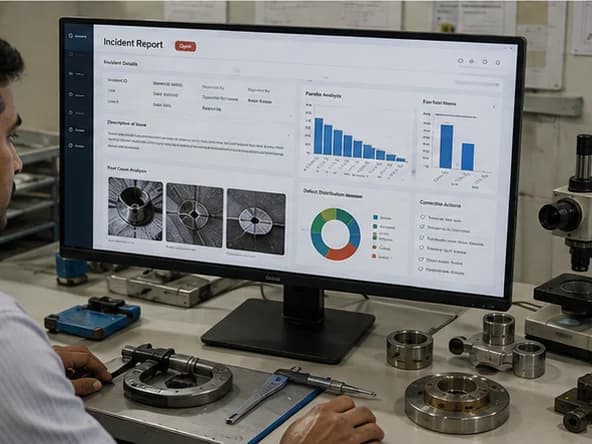
The agent watches reject rates by line, product and defect type, all day. When one moves outside its normal range, it acts at once. It pulls the process parameters for that window. It pulls the material lots in use, tool change records, operator and shift, and any maintenance done in the days before. It compares all this with the last time the defect appeared. Then it drafts the incident report in your own 8D or CAPA format, with the evidence attached.
What lands on the quality manager's desk is not an alert saying rejects are up. It is a filled-in report: rejects are up, here is what changed in that window, and here is what it looked like the last two times. The manager's job becomes judgement instead of assembly.
Needs to be joined up
- Inspection results tagged to machine, tool, shift and material lot.
- Process parameters timestamped closely enough to line up with the spike.
- Tool change and maintenance logs.
- Your own 8D or CAPA template, so the output goes straight into the system of record.
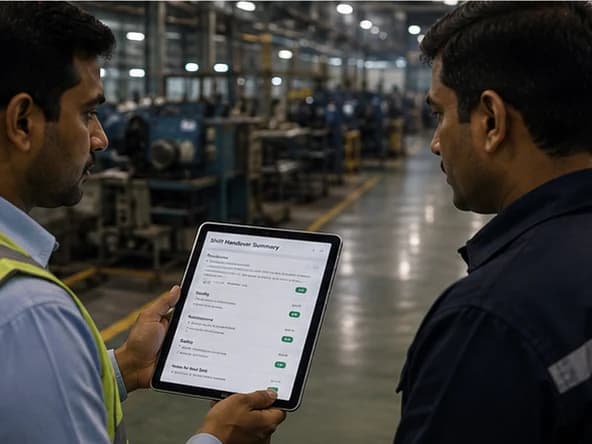
Shift Handover Agent
The handover note written in full each time, even on the shift when all hands are busy.
Handover is where plants lose the thread. On a calm shift the note is thorough. On the shift where three things went wrong, it gets written in four lines by a man who wants to go home. That is the shift where a good note matters most. The incoming supervisor starts without knowing which machine sounded odd at 4am.
The agent builds the handover from what happened: output against plan by line, each stoppage with its duration and cause, and quality exceptions. It adds jobs part-finished and where they stand, open maintenance items, and anything a previous shift flagged to watch. It writes this in the format your plant uses, and posts it where handovers already happen.
The supervisor edits it and adds what only a person knows: the noise that was not quite a fault, or the operator who is off tomorrow. That takes two minutes instead of fifteen, and it also happens on the bad shifts, since the draft is already written.
Quietly valuable because
- It works best on the shifts where people do it worst.
- It builds a searchable record of what happened, shift by shift.
- New supervisors get context that used to live in people's heads.
- It needs no new systems, just production, downtime and quality data you log today.
Sequencing
Which One First
Ranked by how often each is a sound place to start, in a plant that has not done any of this before.
| Use case | Data usually ready? | Time to first result | Best when |
|---|---|---|---|
| Energy Consumption Analytics | Yes — meters and bills | 4–6 weeks | You want a provable win fast |
| Demand Forecasting | Yes — sits in the ERP | 6–8 weeks | Stock and planning are the pain |
| Predictive Maintenance | Partly — history often on paper | 3–4 months | One asset stops the whole line |
| Visual Quality Inspection | Rarely — needs defect images | 3–5 months | Escapes are reaching customers |
| Production Scheduling | Needs cleaning first | 3–4 months | Planning depends on one person |
| Yield Optimisation | Depends on process logging | 4–6 months | Yield drives your margin |
Being Straight About It
Worth doing if
- Plants with a bottleneck asset whose downtime stops everything downstream.
- Operations already recording machine data, even if no one has read it.
- At least a year of maintenance, quality or production records you can retrieve.
- A named person who wants one problem solved and will act on the answer.
Probably not, if
- Plants with no records at all, where six months of logging well beats any model.
- Equipment due for replacement inside two years.
- Problems where the cause is known and the fix is capital, not analytics.
- Firms that want a dashboard for a board pack, not a decision that changes.
FAQ
Questions We Get Asked
More realistic than for a large group, in our experience. You have fewer systems to join up, decisions do not need six approvals, and the person who knows the process is usually in the room. What large makers have is data engineering capacity, and that is the part you buy rather than build. Projects at your scale fail from unclear ownership, not from company size.
No, but be honest about the cost. Typing up two years of job cards takes two to four weeks, and it is worth doing anyway, since you cannot manage maintenance you cannot query. What does kill a project is no record at all: no dates, no reasons, no downtime durations. In that case, start logging well and look at models again in six months.
Usually not. Most equipment built or rebuilt in the last fifteen years already logs temperature, current and cycle time into a PLC, and no one has ever pulled it out. We check what you have before we suggest hardware. Where a sensor really is missing, fitting a few critical assets costs less than people expect, and you can phase it across quarters.
For energy analytics or demand forecasting, four to eight weeks to a first result you can check against your own numbers. For predictive maintenance or vision, three to five months, and most of that is data preparation rather than modelling. Anyone quoting two weeks for a vision system has not asked how many defect images you hold.
That is what the assessment phase is for, and we would rather stop a project in week two than in month five. Sometimes the honest answer is that the data is not there yet. Sometimes the problem is mechanical, not analytical. We will say so. A short job that ends with you not spending money beats a long one that ends in a dashboard no one opens.
Usually yes, though the method varies and it is worth settling early. Older PLCs often speak Modbus or a serial protocol of their own rather than anything modern. The practical route is a small gateway that reads the registers and publishes them somewhere you can query. This is rarely the blocker people expect. What does block a project is a machine with no instruments at all, where the only record of its behaviour is an operator's memory.
No, and we would push back on anyone who sets that as a condition. An MES is a large, disruptive purchase, and most of these use cases run on what you have: PLC data, ERP transactions, quality records. If an MES is on your roadmap for other reasons, do the AI project after it. Buying one in order to start is a very costly way to begin.
Ask each vendor this, and be wary of a vague answer. Running cost is infrastructure, plus model inference where a paid model is used, plus maintenance. Forecasting, predictive maintenance and yield models are cheap to run once built, since they are small models scoring now and then. Vision systems cost more, because they process all day. Agents that use an LLM carry a real cost per action, and it scales with how busy your plant is. Model that against your own volumes before you sign, not after.
Your data is yours and you can export it at any time. We will never hold it hostage. You get the working system, the documentation, and training so your team can run it day to day. What else transfers at the end of an engagement is set out in the contract before work starts. Model artefacts, licence terms and the rest are agreed up front, so there are no surprises either way.
It depends which project. A forecasting model absorbs a new SKU easily once it has some history. A vision system needs new training images for a truly new part, though a variant often needs only a top-up. A model trained on pumps does not transfer to compressors without work. We build the retraining path into handover, so it becomes a scheduled task your team can run, not a support call each time production changes.
That depends on your team, and we would rather be honest than encouraging. If you have a person who is strong in Python and SQL, they can own retraining and monitoring after a handover period. If your IT is one person keeping the ERP alive, they cannot, and pretending otherwise sets everyone up to fail. In that case a support arrangement is the sensible answer, but it should be a choice you make, not something you discover later.
More than most vendors admit. Expect a subject matter expert to give real time during assessment and trial: a maintenance engineer, a quality manager or a planner. Realistically several hours a week for the duration, heaviest at the start and during the trial. This is not optional overhead. It is the difference between a model that fits your plant and one that fits a generic assumption about it.
Recognise your plant in any of that?
Tell us which problem is costing you most and we will tell you honestly whether it is worth building, what data it needs, and roughly what it costs.
Book a Free ConsultationSee our Manufacturing solutions